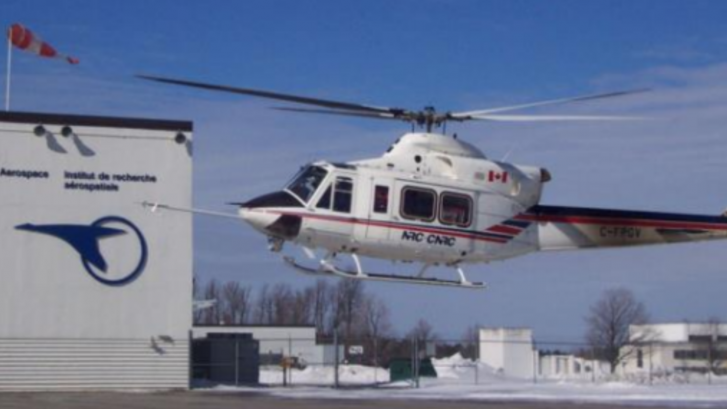
LPVR-DUO in an Airborne Helicopter
In-Flight VR
Imagine soaring through the skies as a pilot, testing the limits of a helicopter’s capabilities while feeling the rush of wind and turbulence. Now imagine that you don’t see the real world outside and the safe landing pad that your helicopter is approaching but a virtual reality (VR) scene where you are homing in on a ship in high seas. The National Research Council Canada (NRC) and Defence Research and Development Canada (DRDC) have brought this experience to life with their groundbreaking Integrated Reality In-Flight Simulation (IRIS).

IRIS is not your ordinary simulator; for one, it’s not sitting on a hexapod, it’s airborne. It’s a variable-stability helicopter based on the Bell 412 that can behave like other aircraft and can simulate varying weather conditions; combine that with a VR environment and you have a tool that allows safely training operations in the most adverse conditions. In particular it is used for Ship Helicopter Operating Limitations (SHOL) testing.
Mission-Critical Application with LPVR-DUO
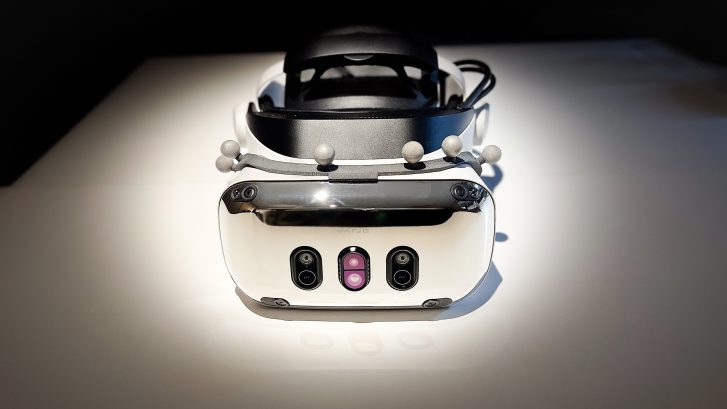
The LPVR-DUO system is what makes VR possible on this constantly moving platform. This cutting-edge AR/VR tracking system seamlessly merges the inertial measurements taken by the headset with the helicopter’s motion data and a camera system mounted inside the cabin to provide the correct visuals to the pilot. The challenges of using cameras to track the VR headset inside the tight environment of the helicopter while lighting conditions are ever-changing are overcome by using an ART SmartTrack 3 system. This system follows an arrangement of reflective markers attached to the pilot’s helmet. The VR headset is attached to the helmet in such a way that the pilot can wear it as if it were a pair of night vision goggles. Put together, this allows displaying a virtual world to the pilot, even in the most extreme maneuvers.

To ensure an authentic experience, the IRIS system incorporates real-time turbulence models, meticulously crafted from wind tunnel trials. These turbulence effects are seamlessly integrated into the aircraft’s motion and into the VR scene, providing pilots with precise proprioceptive and vestibular cues. It’s a symphony of technology and innovation in the world of aviation testing.

In-Cockpit Implementation
The optical tracking system relies on highly reflective marker targets on the helmet to track movement in three dimensions. Initially, only five markers were installed, strategically placed for optimal tracking. But the pursuit of perfection led NRC to create custom 3D-printed low-reflectivity helmet molds, allowing them to mount a dozen small passive markers. This significantly improved tracking reliability in various lighting conditions and allowed for a wider range of head movement.
Recently, NRC put this remarkable concept to the test with actual flight trials. The response from pilots was nothing short of exhilarating. They found the system required minimal adaptation, exhibited no noticeable lag, and, perhaps most impressively, didn’t induce any motion sickness. Even the turbulence effects felt incredibly realistic. Surprisingly, the typical VR drawbacks, such as resolution and field of view limitations, had minimal impact, especially during close-in shipboard operations. It’s safe to say that IRIS has set a new standard for effective and immersive aviation testing.
Publication of Results
The NRC team presented their results at the Vertical Flight Society’s 79th Annual Form in two papers [1] and [2] and they also have a blog post on their site.
NOTE: Image contents courtesy of Aerospace Research Centre, National Research Council of Canada (NRC) – Ottawa, ON, Canada


")
 (1)")