How to Connect an LP-Research IMU to ROS (Update)

Introduction

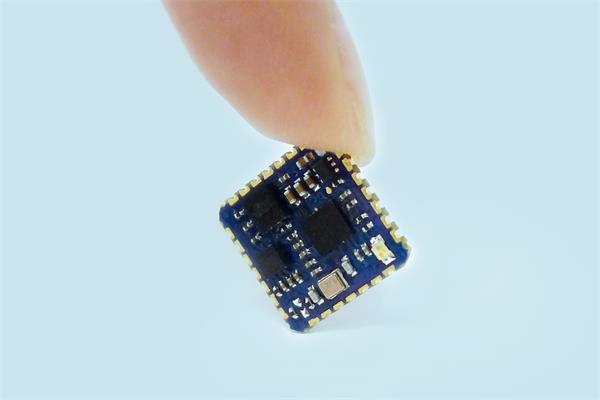
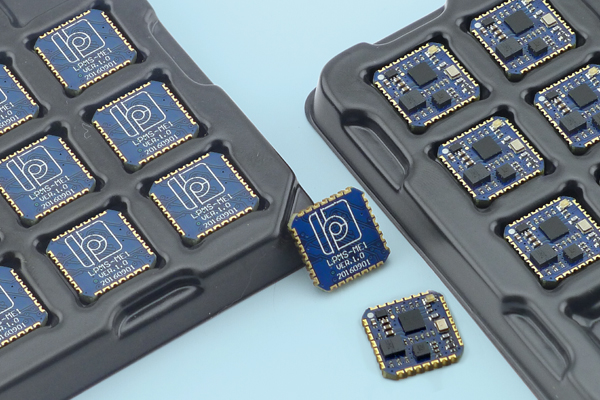
This article describes how to connect an LP-RESEARCH inertial measurement unit (IMU) using a Robot Operating System (ROS) node. We are happy to announce that our IMU ROS sensor driver has been accepted into the official ROS package repository. The Robot Operating System, or ROS in short, is an open-source de-facto standard for robotics sensing and control.

With the package openzen_sensor now provided as part of the ROS distribution Melodic Morenia it just became a whole lot easier to use our sensors in robotic applications.

Note: This article covers our node for ROS 1. Please see further information regarding our ROS 2 node at the end of this article. This post is a follow-up to our previous ROS driver release.

Published ROS Topics

These are the ROS topics which are published by the OpenZen ROS driver:

Message

Type

Description

/imu/data

Inertial data from the IMU. Includes calibrated acceleration, calibrated angular rates and orientation. The orientation is always unit quaternion.

/imu/mag

Magnetometer reading from the sensor.

/imu/nav

Global position from a satellite navigation system. Only available if the IMU includes a GNSS chip.

/imu/is_autocalibration_active

Latched topic indicating if the gyro autocalibration feature is active.

Installation of the LPMS ROS Driver

All that’s needed is to install the package openzen_sensor via your Linux distribution’s package manager. In Ubuntu, with the ROS Melodic Morenia distribution installed, use the following command:

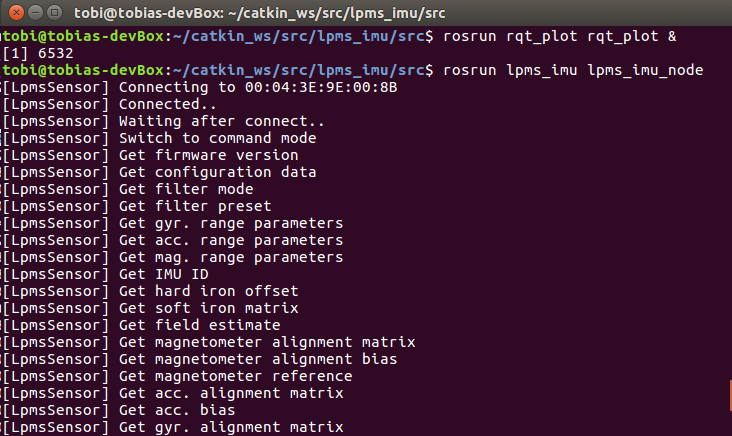
Once the IMU ROS driver package is installed, we use the following command to start the OpenZen node:

This will automatically connect to the first available IMU and start streaming its accelerometer, gyroscope and magnetometer data to ROS. If your sensor is equipped with a GPS unit, global positioning information will also be transferred to ROS.

Once a sensor has been connected via the motion sensor driver, the data from the sensor is exported via ROS topics which can be consumed by other ROS components such as a navigation and path planning system.

Outputting IMU sensor values on the command line can now be easily done with:

and the data can be plotted with:

More information on the usage of the OpenZen IMU ROS driver can be found in the repository of the driver.

The image above shows an angular velocity output graph in the ROS MatPlot application from an LPMS-IG1 sensor.

ROS 2 Release

We have recently released a ROS 2 version of our OpenZEN ROS node. The node is not part of an official ROS2 release yet, but it works well on the latest release Foxy. For surther information and source code see the OpenZenROS2 repository.

Large-scale VR Application Case: the Holodeck Control Center

The AUDI Holodeck

LPVR interaction

Our large-scale VR solution allows any SteamVR-based (e.g. Unity, Unreal, VRED) Virtual Reality software to seamlessly use the HTC VIVE headset together with most large-room tracking systems available on the market (OptiTrack, Vicon, ART). It enables easy configuration and fits into the SteamVR framework, minimizing the effort needed to port applications to large rooms.

One of our first users, Lightshape, have recently released a video showing what they built with our technology.  They call it the Holodeck Control Center, an application which creates multi-user collaborative VR spaces. In it users can communicate and see the same scene whether they are the same real room or in different locations. The installation showcased in the video is used by German car maker Audi to study cars that haven’t been built yet.

Our technology is essential in order to get the best VR experience possible on the 15m × 15m of the main VR surface, combining optical tracking data and IMU measurements to provide precise and responsive positioning of the headsets.  Please have a look at Lightshape’s video below.

Ready for the HTC Vive Pro

In the near future, this installation will be updated to the HTC Vive Pro which our software already supports. The increased pixel density of this successor of the HTC Vive will make the scenes look even more realistic. The resolution is high enough to actually read the various panels once you are in the drivers seat! Besides that, we are also busy studying applications of the front-facing cameras of the Vive Pro in order to improve multi-user interaction.

Robot Operating System and LP-Research IMUs? Simple!

NOTE: We have released a new version of our ROS / ROS 2 driver, please refer to this post.


Introduction

Robot Operating System (ROS) is a tool commonly used in the robotics community to pass data between various subsystems of a robot setup. We at LP-Research are also using it in various projects, and it is actually very familiar to our founders from the time of their PhDs. Inertial Measurement Units are not only a standard tool in robotics, the modern MEMS devices that we are using in our LPMS product line are actually the result of robotics research. So it seemed kind of odd that an important application case for our IMUs was not covered by our LpSensor software: namely, we didn’t provide a ROS driver.  We are very happy to tell you that such a driver exists, and we are happy that we don’t have to write it ourselves: the Larics laboratory at the University of Zagreb are avid users of both ROS and our LPMS-U2 sensors. So, naturally, they developed a ROS driver which they provide on their github site.  Recently, I had a chance to play with it, and the purpose of this blog post is to share my experiences with you, in order to get you started with ROS and LPMS sensors on your Ubuntu Linux system.

Installing the LpSensor Library

Please check our download page for the latest version of the library, at the time of this writing it is 1.3.5. I downloaded it, and then followed these steps to unpack and install it:

I also installed libbluettoth-dev, because without Bluetooth support, my LPMS-B2 would be fairly useless.

Setting up ROS and a catkin Work Space

If you don’t already have a working ROS installation, follow the ROS Installation Instructions to get started. If you already have a catkin work space you can of course skip this step, and substitute your own in what follows.  The work space is created as follows, note that you run catkin_init_workspace inside the src sub-directory of your work space.

Downloading and Compiling the ROS Driver for LPMS IMUs

We can now download the driver sources from github. It optionally makes use of and additional ROS module by the Larics laboratory which synchronizes time stamps between ROS and the IMU data stream.  Therefore, we have to clone two git repositories to obtain all prerequisites for building the driver.

That’s it, we are now ready to run catkin_make to get everything compiled and ready.  Building was as simple as running catkin_make, but you should setup the ROS environment before that.  If you haven’t, here’s how to do that:

This should go smoothly. Time for a test.

Not as Cool as LpmsControl, but Very Cool!

Now that we are set up, we can harness all of the power and flexibility of ROS. I’ll simply show you how to visualize the data using standard ROS tools without any further programming.  You will need two virtual terminals.  In the first start roscore, if you don’t have it running yet.  In the second, we start rqt_plot in order to see the data from our IMU, and the lpms_imu_node which provides it.  In the box you can see the command I use to connect to my IMU. You will have to replace the _sensor_model and _port strings with the values corresponding to your device.  Maybe it’s worth pointing out that the second parameter is called _port, because for a USB device it would correspond to its virtual serial port (typically /dev/ttyUSB0).

Once you enter these commands, you will then see the familiar startup messages of LpSensor as in the screenshot below. As you can see the driver connected to my LPMS-B2 IMU right away. If you cannot connect, maybe Bluetooth is turned off or you didn’t enter the information needed to connect to your IMU.  Once you have verified the parameters, you can store them in your launch file or adapt the source code accordingly.

Screenshot starting LPMS ROS node

Screenshot of starting the LPMS ROS node

The lpms_imu_node uses the standard IMU and magnetic field message types provided by ROS, and it publishes them on the imu topic.  That’s all we need to actually visualize the data in realtime.  Below you can see how easy that is in rqt_plot. Not as cool as LpmsControl, but still fairly cool. Can you guess how I moved my IMU?

animation of how to display LPMS sensor data in ROS

Please get in touch with us, if you have any questions, or if you found this useful for your own projects.

Update: Martin Günther from the German Research Center for Artificial Intelligence was kind enough to teach me how to pass ROS parameters on the command line.  I’ve updated the post accordingly.

New Miniature Sensor In: LPMS-ME1 Maker Edition!

20160808lpmsme1onfinger600x400_1

The LPMS-ME1’s Maker Edition is miniature-sized with just 12 x 12 x 2.6 mm.

We proudly present you our latest development! The LPMS-ME1 is our smallest motion sensor so far, with just 12 x 12 x 2.6 mm it is tiny! Despite its size this powerful 9-axis inertial measurement unit (IMU) has several sensors integrated, for example a 3-axis accelerometer, a 3-axis gyroscope and a 3-axis magnetometer. And this miniature motion sensor certainly comes at low cost.

It is very easy to assemble and can be conveniently embedded in the system of your choice. Due to its size it is perfect for your design ideas and development projects. Just to to give you some inspiration, it can be used for human motion capture or sports performance evaluation, for various sorts of Internet of Things (IoT) devices, and can be used to control unmanned aerial vehicles. You can even fly a drone with it!

Have a look at more specifications in our data sheet. This sensor comes with our own LpmsControl utility software and a one-year warranty service.

Get the LPMS-ME1 Maker Edition for your own innovations! Find a distributor of your choice or order online at Zenshin Tech.

20160808lpmsme1_box_600x400


Machine Learning for Context Analysis

Deterministic Analysis vs. Machine Learning for Context Analysis

Machine learning for context analysis and artificial intelligence (AI) are important methods that allow computers to classify information about their environment. Today’s smart devices integrate an array of sensors that constantly measure and save data. On the first thought one would image that the more data is available, the easier it is to draw conlusions from this information. But, in fact larger amounts of data become harder to analyze using deterministic methods (e.g. thresholding). Whereas such methods by themselves can work efficiently, it is difficult to decide which analysis parameters to apply to which parts of the data.

Using machine learning techniques on the other hand this procedure of finding the right parameters can be greatly simplified. By teaching an algorithm which information corresponds to a certain outcome using training and verification data, analysis parameters can be determined automatically or at least semi-automatically. There exists a wide range of machine learning algorithms including the currently very popular convolutional neural networks.

Context analysis setup overview

Figure 1 – Overview of the complete analysis system with its various data sources

Context Analysis

Many health care applications rely on the correct classification of a user’s daily activities, as these reflect strongly his lifestyle and possibly involved health risks. One way of detecting human activity is monitoring their body motion using motion sensors such as our LPMS inertial measurement unit series. In the application described here we monitor a person’s mode of transportation, specifically

  1. Rest
  2. Walking
  3. Running
  4. In car
  5. On train

To illustrate the results for deterministic analysis vs. machine learning for context analysis approach we first implemented a state machine based on deterministic analysis parameters. An overview of the components of this system are shown in Figure 1.

Deterministic approach overview

Figure 2 – Deterministic approach

The result (Figure 2) is a relatively complicated state machine that needs to be very carefully tuned. This might have been because of our lack of patience, but in spite of our best efforts we were not able to reach detection accuracies of more than around 60%. Before spending a lot more time on manual tuning of this algorithm we switched to a machine learning approach.

Machine learning approach overview

Figure 3 – Machine learning approach

The eventual system structure shown in Figure 3 looks noticeably simpler than the deterministic state machine. Besides standard feature extraction, a central part of the algorithm is the data logging and training module. We sampled over 1 milion of training samples to generate the parameters for our detection network. As a a result, even though we used a relatively simple machine learning algorithm, we were able to reach a detection accuracy of more than 90%. A comparison between ground truth data and classification results from raw data is displayed in Figure 4.

Context analysis algorithm result

Figure 4 – Result graphs comparing ground truth and analysis output for ~1M data points

Conclusion

We strongly belief in the use of machine learning / AI techniques for sensor data classification. In combination with LP-RESEARCH sensor fusion algorithms, these methods add a further layer of insight for our data anlysis customers.

If this topic sounds familiar to you and you are looking for a solution to a related problem, contact us for further discussion.

1 2